All projects
Regional Plan Tracking
Live dashboards tracking development in the Tahoe basin against the Regional Plan's growth caps: how much has been built, how much each jurisdiction holds, and what remains.
Live dashboards tracking development in the Tahoe basin against the Regional Plan's growth caps: how much has been built, how much each jurisdiction holds, and what remains.
Development in the Tahoe basin is governed by hard caps set in the 1987 and 2012 Regional Plans: a fixed pool of residential allocations, bonus units, commercial floor area, and tourist accommodation units. Tracking how much of each pool has been authorized, how much sits with jurisdictions, and how much is still available is central to regional planning, but that accounting lived in databases and spreadsheets, out of public view.
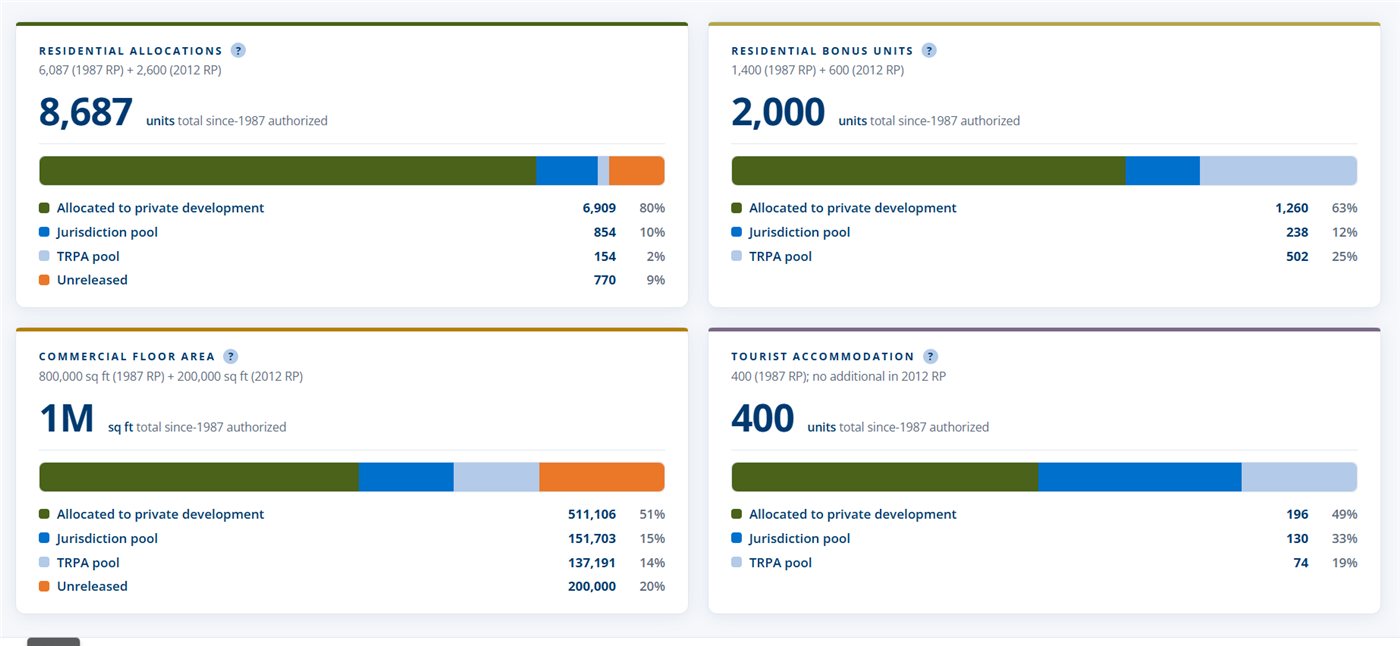
// the approachI built a set of live dashboards that turn the development-rights ledger into clear, public visualizations. Each commodity (residential allocations, bonus units, commercial floor area, tourist accommodation) gets a headline total since 1987 and a breakdown of where it stands: allocated to private development, held in the jurisdiction pool, held in the TRPA pool, or still unreleased.
An ETL pipeline reads from the agency's allocation and permitting data, reconciles it against the plan caps, and publishes the figures the dashboards render. Pairing each metric with its plan basis (1987 versus 2012) keeps the numbers traceable back to the policy they measure.
// the outcomeJurisdictions, applicants, and the public can now see the basin's growth budget at a glance instead of requesting a report. The dashboards make a genuinely complex accounting system legible, and because they are pipeline-driven they reflect the current state of development rights rather than a point-in-time snapshot.